Project’s goal
Empowering a 25 sell-side stock broker team and allow the sales manager to identify clients’ clusters for sales campaigns.
Challenges
A London based stock brokerage company promotes and sells listed securities to financial institutions. The management analysis aggregates sales activity on different dimensions: sales per client, per salesman and per month. This analysis is conducted on a weekly basis and the current data handling process is heavy and time consuming, as it requires two separate data sources: client information in a custom CRM system, and the underlying listed company shareholders’ register which is provided by a third party via csv files. Crossing both data sources requires heavy lifting on behalf of analysts, that involves extracting CRM data into Excel, manually joining tables to build a master pivot table, and producing Excel and PowerPoint interfaces.

An automated back-end
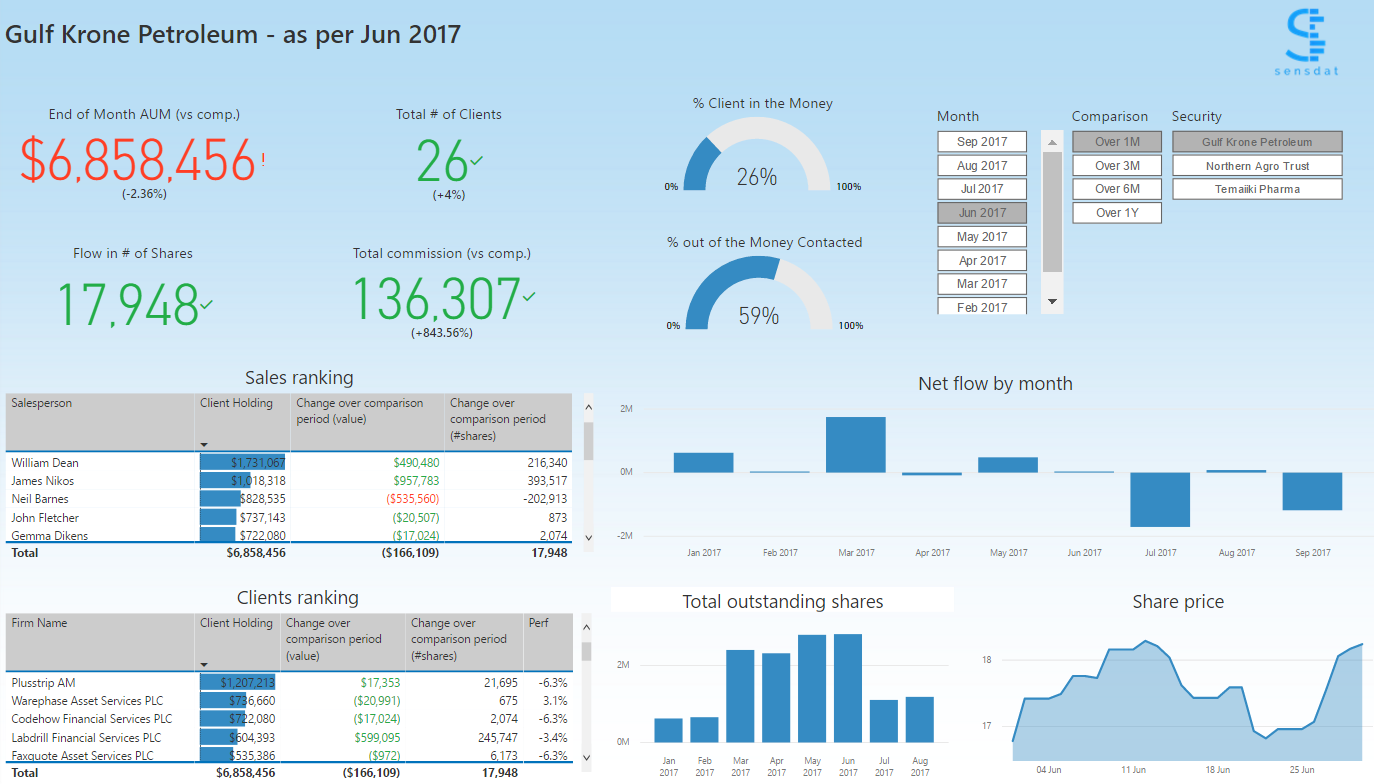
We spent time with the operations director and head of sales to develop a dashboard that allows the management to have an overview of the business and drill into KPIs in a couple of clicks. The solution automates the steps normally taken by analysts to produce the report: each night, data is automatically pulled from the CRM as well as the csv files – no need to worry about data refresh anymore. The data model we developed combines the two sources to enable cross-analysis, and automatically cleans the data from any input mistakes. End users can now log on their portal and have access to reports refreshed with data from the day before.
An interactive dashboard
Members of the sales team can interact with the report and drill into clients’ characteristics. In a click, they can change the report’s date and comparison period, focus on a client by clicking on their name in the table, or filter the entire report on “clients out of the money” only. The head of sales soon realises that in June, three-quarters of clients were out of the money, but only 60% of them had been contacted since they had last bought stocks.
Key benefits
Save time
The automated process for data handling and report creation saves time to focus on adding value tasks: the analyst can reallocate about 20 hours per month for front activity support.
Add value
The range of KPIs on clients’ activity makes the sales director and his team better equipped to grow the business. Such a gain in resources allows them to be more proactive for sales campaigns and bring key information to customers during a sales pitch. For example, salespeople know a client’s average buying price, whatever number of trades they have made over time. Client retention has improved since clients receive clear statements of their investment – the sales have detailed and always up-to-date material for client meetings.
Reinforce team work
The dashboard is identical for all users (the head of sales and each member of his team) to respect one single version of the truth. However, the access to data follows rules according to hierarchy. The head of sales will thus see 100% of the data of the report, and each salesperson will see data corresponding to their clients only. Sales campaigns and expansion strategies can be better timed and targeted.


Recent Comments